


| EUROCOM P150EM Racer 2 | |
| Configure | Specs | Upgrade | Components | Images | Videos | Brochure | Benchmarks | Reviews | Manual | Drivers |
 |
15.6-inch FHD 1920-by-1080 pixels; Matte (Non-Glare) or Glossy (Glare); LED Backlit Display; 95% Gamut/NTSC Optional |
| Processor EUROCOM Racer 2.0 (HM77)- Ivy Bridge vs. Sandy Bridge Processor Testing Apr 23, 2012 Category: Performance |
Intel Core i7-3920XM Mobile Extreme Edition 2.90 GHz (turbo frequency up to 3.80); 4C/8T; 8MB L3; 22nm (Ivy-Bridge); uFPGA988B; 55W; Intel Core i7-2960XM Mobile Extreme Edition 2.70 GHz (turbo frequency up to 3.70); 4C/8T; 8MB L3; 32nm (Sandy-Bridge); FCPGA988; 55W; |
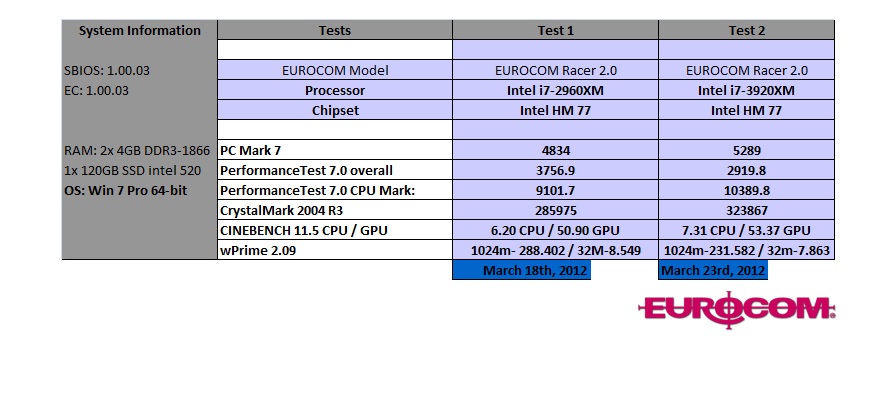
| PCMark 7 - Higher score is better -Overal system performance benchmark PerformanceTest 7.0 Overall - Higher score is better -Quickly assess the performance of computer and compare it to standard 'baseline' computer systems. PerformanceTest 7.0 CPU Mark - Higher score is better -Quickly assess the performance of Processor and compare it to standard 'baseline' computer systems. CrystalMark 2004 R3 - Higher score is better -CrystalMark 2004R3 is a 32bit total benchmark software. CINEBENCH 11.5 CPU / GPU - Higher Score is better -CINEBENCH is a real-world cross platform test suite that evaluates your computer's performance capabilities. wPrime 2.09 - Lower score is better -wPrime is a leading multithreaded benchmark for x86 processors that tests your processor performance by calculating square roots with a recursive call of Newton's method for estimating functions, |